
Species distribution models link observed occurrences to environmental conditions to estimate where species occur. SAGE is a global benchmark that combines community-science records with expert-curated vegetation plots to evaluate model performance, with a focus on how models differ across species with different sampling patterns.
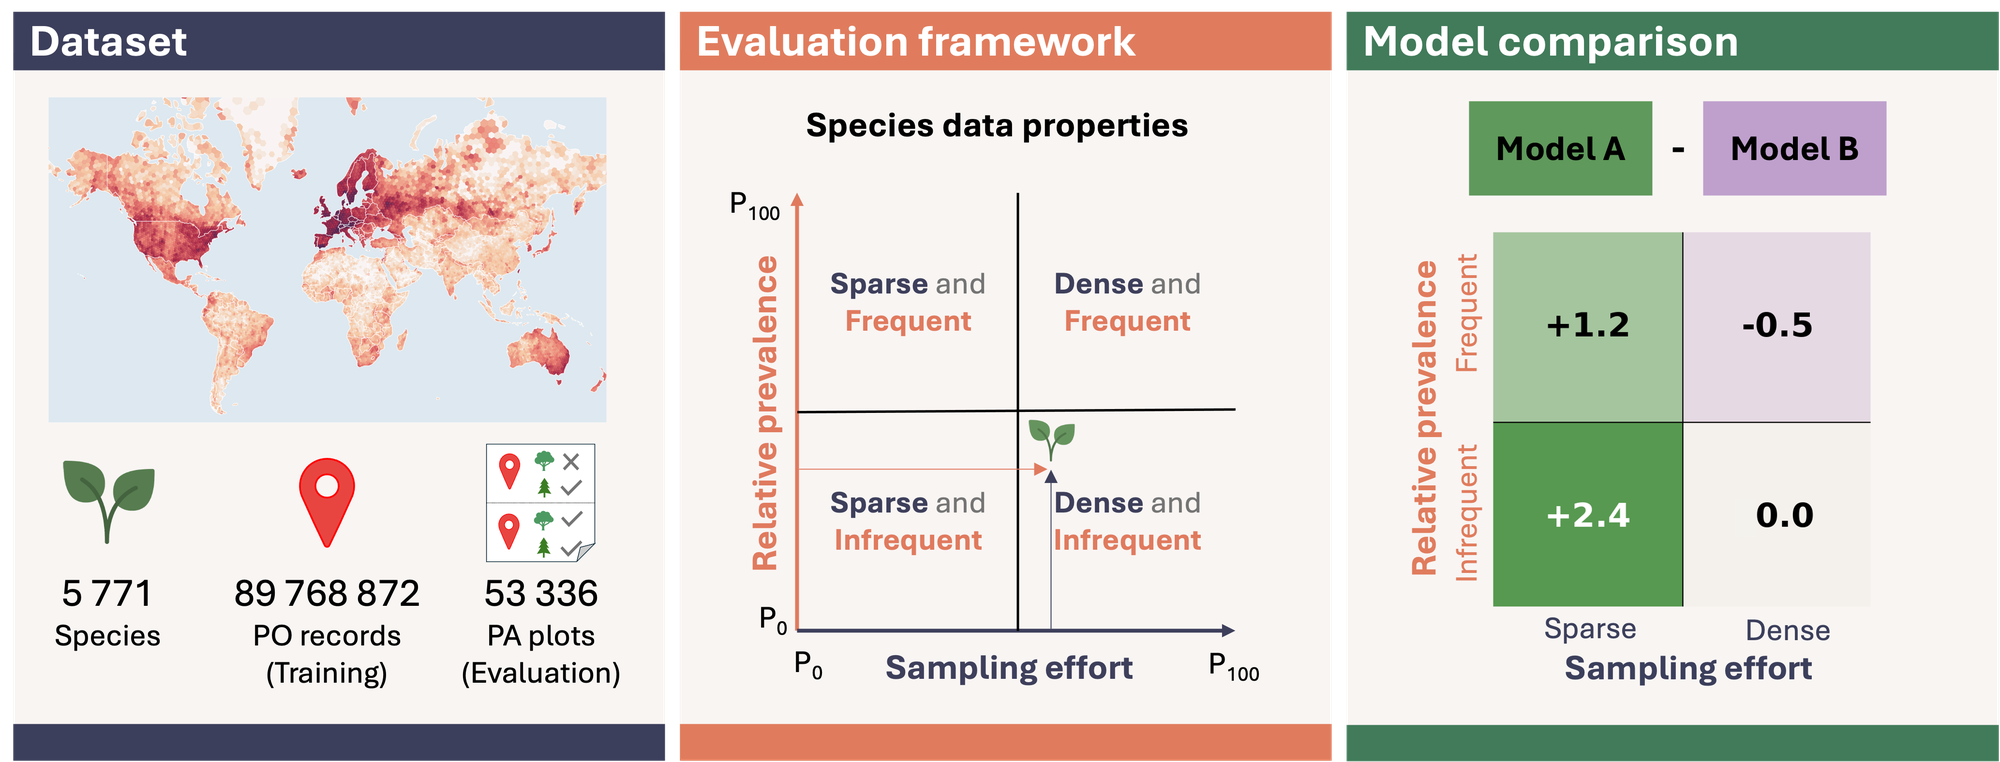
Overview of SAGE. Dataset: 89.8 million presence-only occurrences from GBIF paired with 53,336 expert-curated presence–absence vegetation plots from sPlotOpen, covering 5,771 non-anonymized plant species. Evaluation framework: each species is characterized by sampling effort and relative prevalence, defining a two-dimensional space partitioned into sparse versus dense sampling effort and infrequently versus frequently recorded species. Model comparison: models are compared across this space, with performance differences reported per quadrant rather than as a single average.
Why a sampling-aware benchmark
Community-science occurrence records are geographically and taxonomically uneven, and these biases affect both model training and evaluation. As multi-species models scale to thousands of species, averaging performance across species hides substantial variation and makes it difficult to see which species a model serves well or poorly.
SAGE addresses this with a sampling-aware evaluation framework. Each species is characterized by sampling effort, the coverage of its range by occurrence records, and relative prevalence, how often it is recorded where sampling occurs. Model comparisons are reported across the groups defined by these properties, rather than as a single aggregate score.
The benchmark provides the dataset, evaluation framework, and reproducible baselines needed to assess where different modeling approaches perform more or less effectively.
How species are grouped
Two complementary properties of occurrence data define the groups used for evaluation.
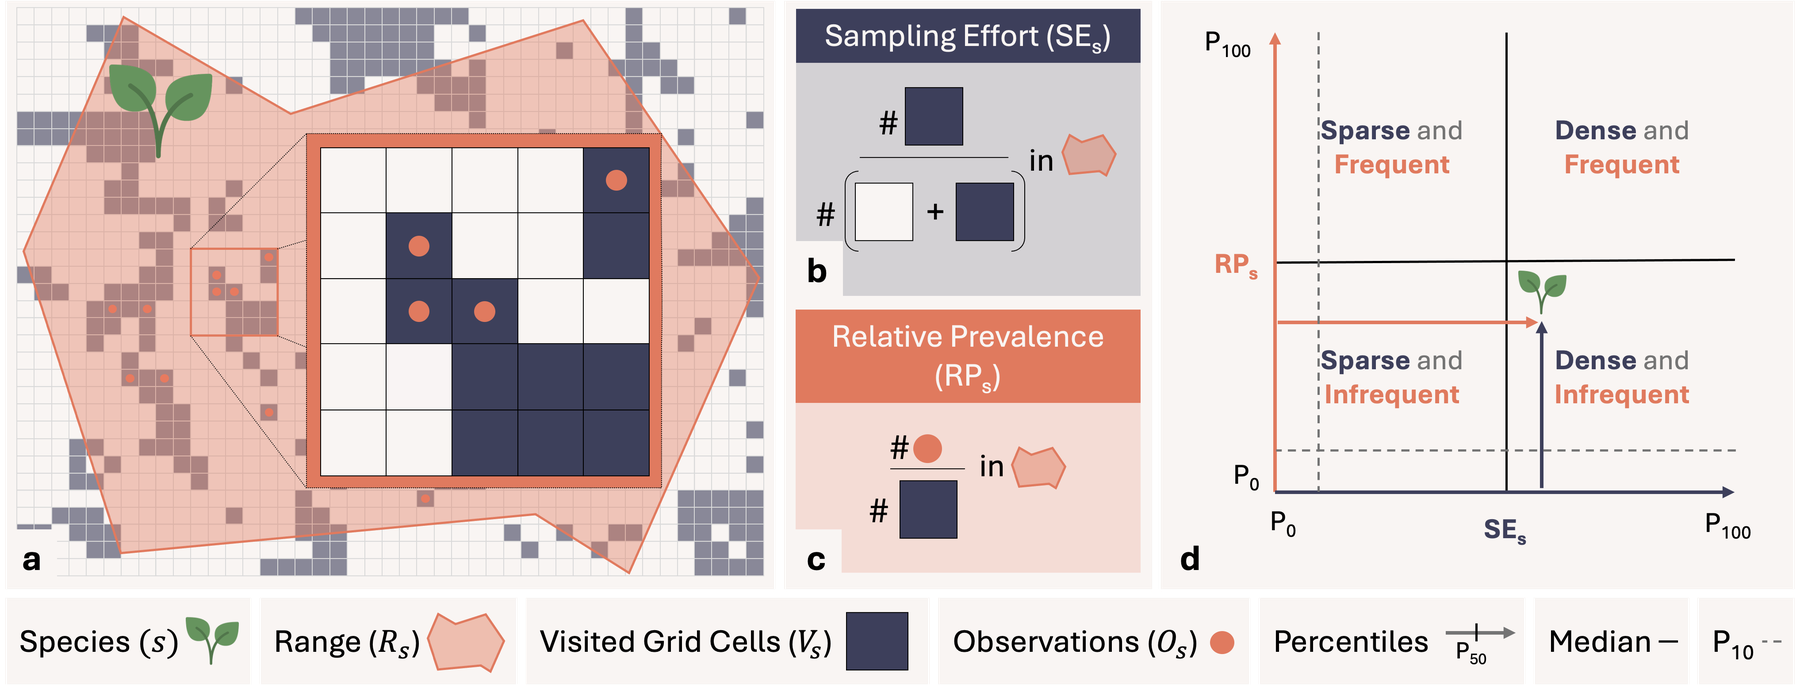
Sampling effort is the fraction of grid cells within a species' native range containing at least one occurrence record from any species. Relative prevalence is the fraction of visited cells within the range where the species was recorded. The resulting two-dimensional space is split at the median of each property into four groups; species in the lowest decile of either property are also highlighted.
Explore the benchmark
 Explore the dataExplore the occurrence records, evaluations plots and predicted maps
 Compare modelsSee performance comparisons across different sampling regimes
 Evaluate your modelUpload predictions and evaluate your own species distribution model
Cite